Kavya
Maragoni
Client Needs:
ESN sought a solution that streamlined data interpretation, supported more efficient decision-making for its users, and enhanced the usability of its existing energy management dashboards.
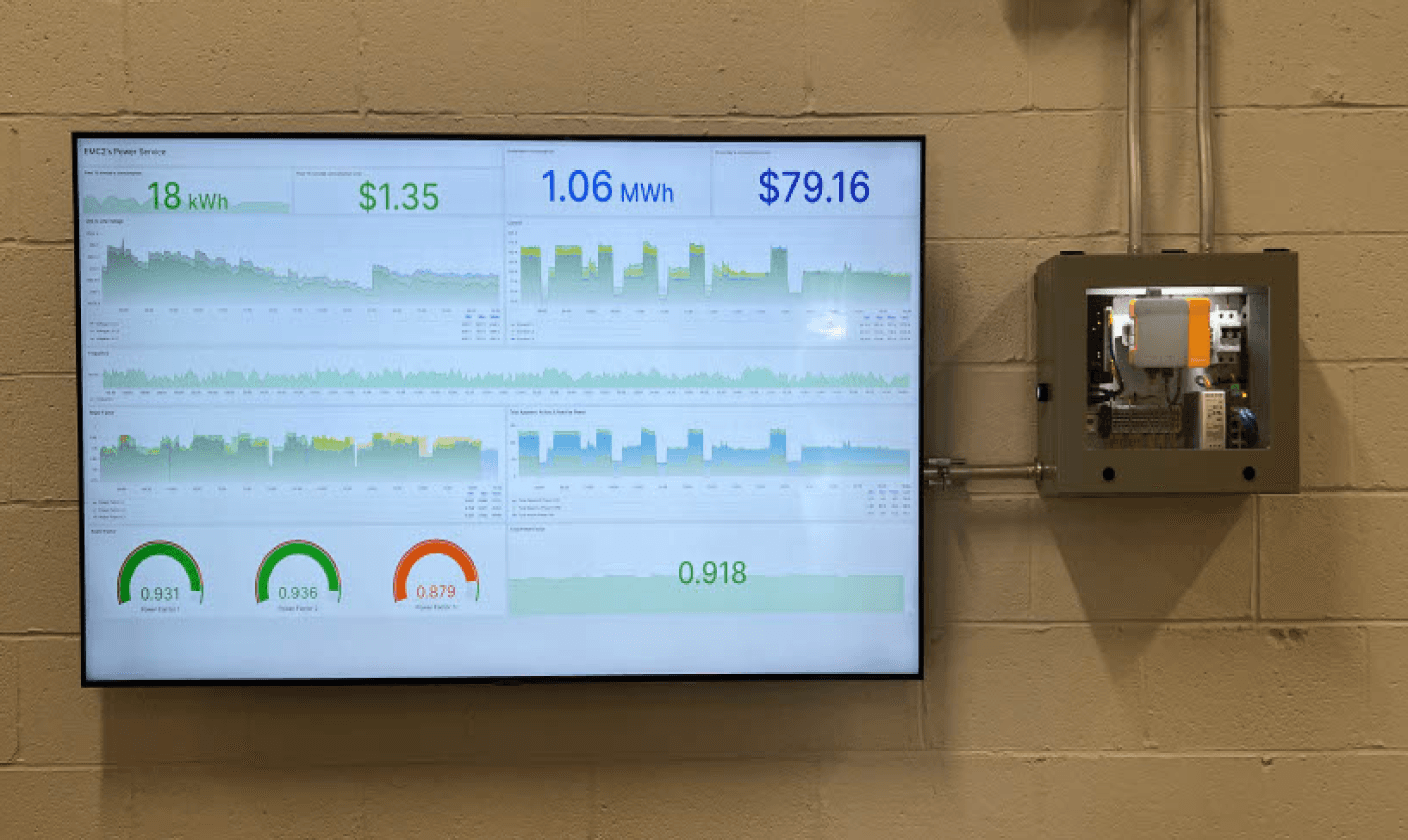
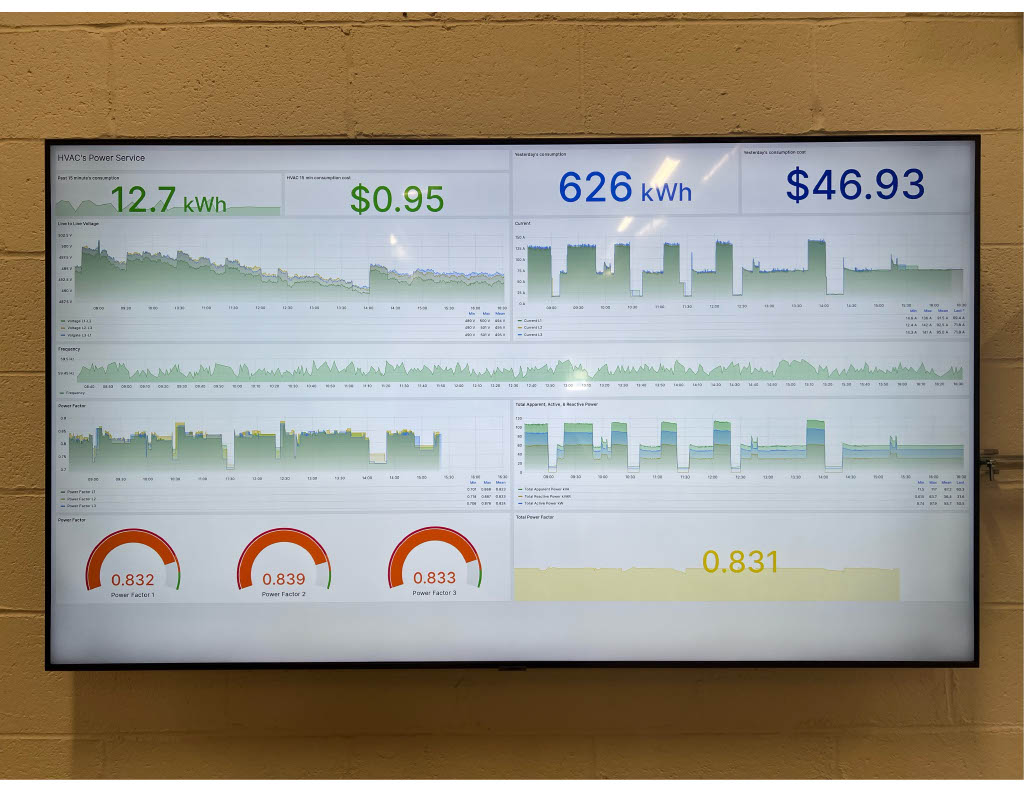
Dashboards and the persona that they were using previously


Analyzing the dashboard based on four pillars of data storytelling

Visual Design
Design principles
Design elements
Audience
Understanding audience
Clear purpose/goal
Narrative
Language and Messaging
Data
Quality data source
Statistical analysis

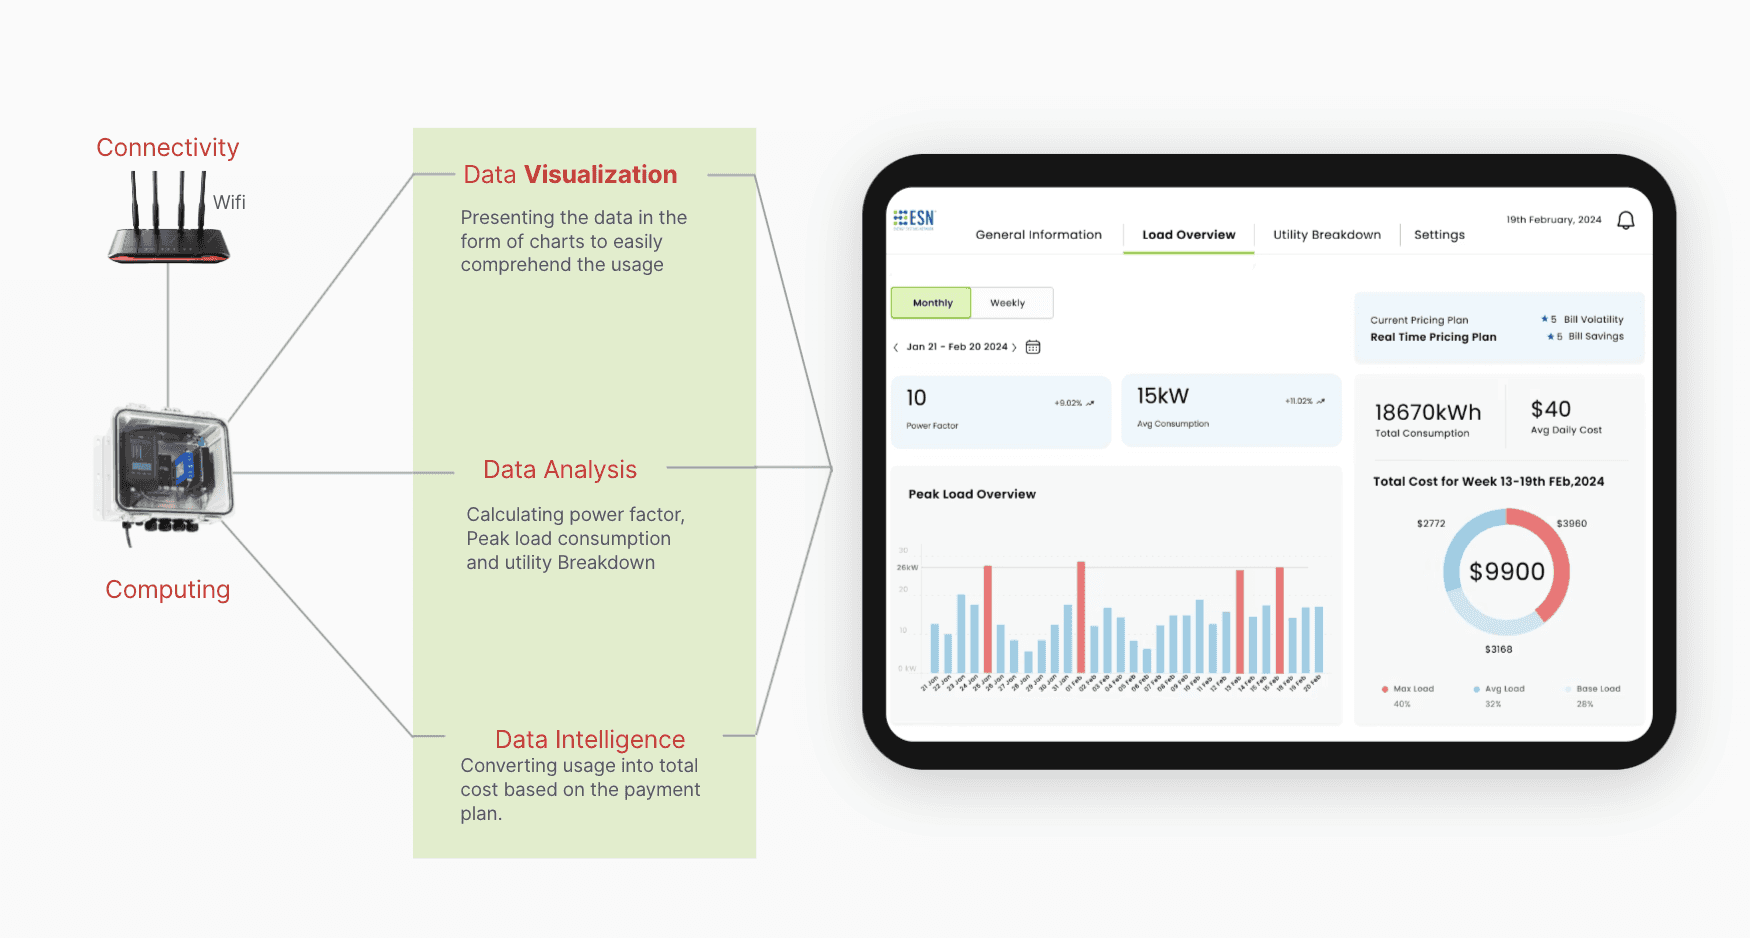
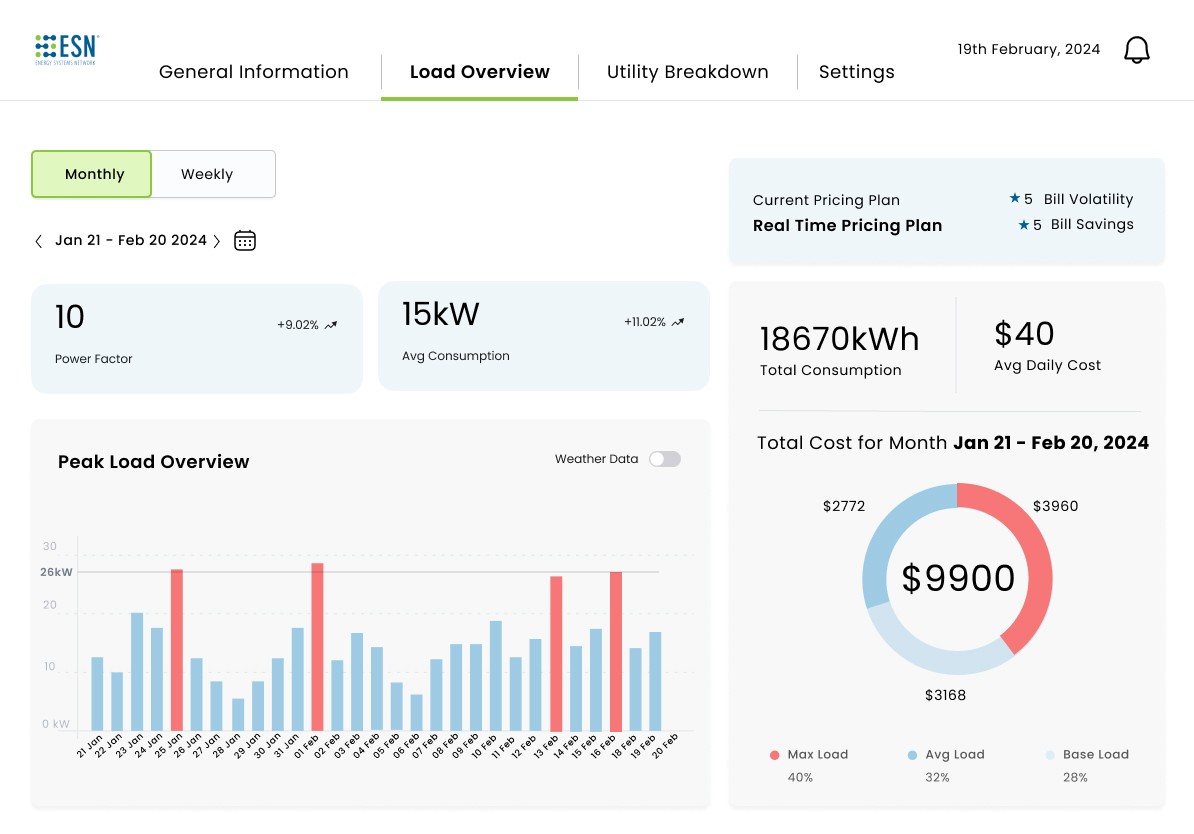
Here's how we re-designed dashboard

Personalised Solution for every plant
Insight: "A one-size-fits-all solution does not give insights tailored to the plant".
Importance: Our interviews revealed that plant managers are constantly looking for solution that are tailored to their plant.
Visualizing Energy Usage in Monthly and Weekly views
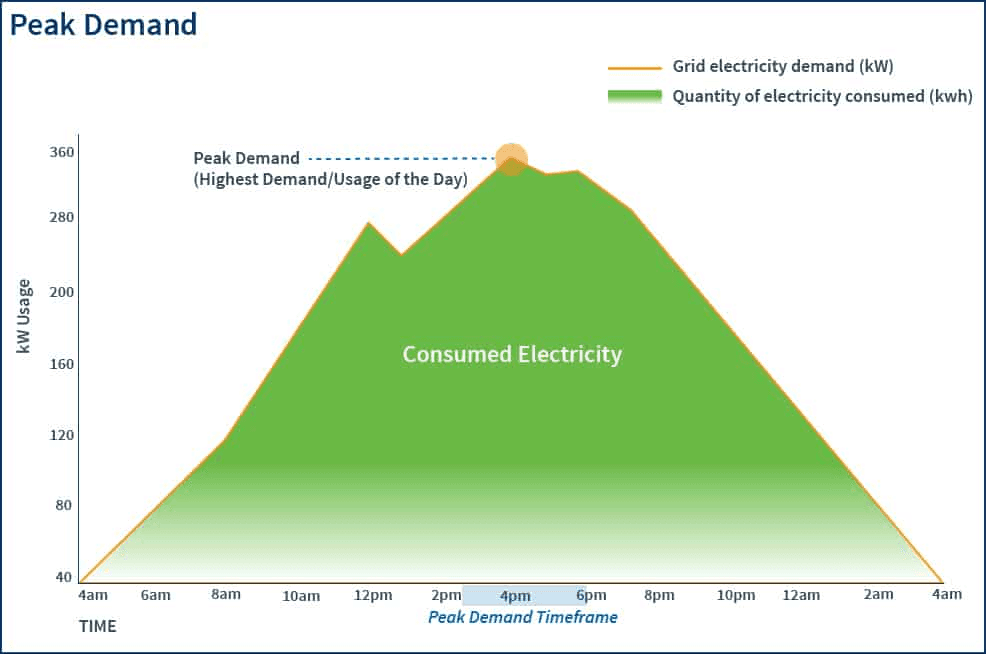
Insight: Demand charge is based upon the Peak Load of power consumed over fifteen minutes in a given month
Importance: Demand charges can lead to more expensive bills overall.
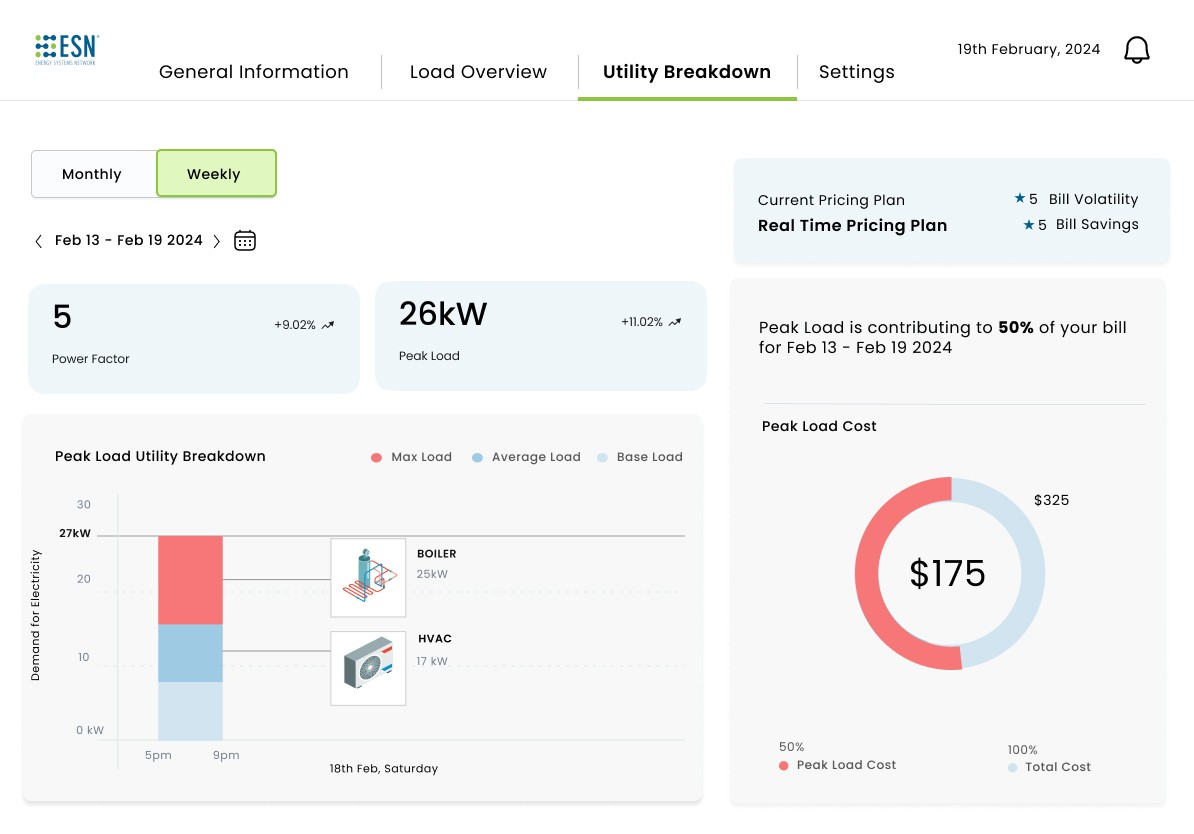
Identifying Machinery Contributions to Load Usage
Insight: "The technical jargon makes it overwhelming to see past the visualisations and comprehend the data"
Importance: Plant managers are not equipped with complete understanding about energy and it's metrics. Therefore it's hard for them to see past the visualisation and make actions based on that.
Impact
Expressed enthusiasm in implementing the solution
Reported the peak load breakdown to be insightful for their operations
4/5
5/5
5/5
T
Reported the dashboard to be intuitive and less overwhelming compared to what they currently use
We conducted think-aloud sessions with plant managers, our target users, at a roadshow and collected qualitative feedback.
How did we arrive at the solution?
Understanding User
Major challenge:
No access to target users to conduct interviews.
Workaround:
Conducted interviews with five key stakeholders (Developers and integrators), who regularly interacted with users.
Result:
Gathered insights into their job responsibilities, needs, and the issues they encounter in their work, helping me to better understand the user context indirectly.
Meet our User Persona
Challenges Eric faced


Consumption cost calculation and savings
Lack of customizable solutions to accommodate their machinery.
Finds technical jargon on the dashboard overwhelming
About Eric:
Eric is a seasoned Plant Manager with 20 years of experience in the industry. Despite his extensive experience, Eric is not particularly well-versed in energy systems but is eager to collaborate with energy experts to implement best practices for improving energy efficiency.
His daily responsibilities include monitoring machine data, supervising operations, and making critical decisions based on plant performance.
Understanding Business
Market scope and Trends:
Adapting to regulatory changes like
Incentives for energy efficiency measures
Compliance with sustainability standards.
Regulatory Changes
Growing awareness and concern about environmental sustainability and carbon footprint.
Therefore, emphasis on controlling energy consumption
Sustainability
Integration of advanced technologies such as IoT, AI, and ML for real-time monitoring, predictive analytics, and automation in energy management to increase energy-saving opportunities.
Technological Advancements
Business scope and needs:
The global market size is projected to grow from $31.75 billion in 2023 to $82.34 billion by 2030, at a CAGR of 12.6%. Source
Rise of energy management
Cost reduction
Sustainability and Compliance
Operational Efficiency
Technological Innovation
Customers Needs
Balancing business and user needs
Technological innovation
Sustainability and Compliance
Usability
Operational efficiency
Cost reduction
Customozibale solutions
User
Business
Machine health overview
Seasonal Data Integration
Future Scope
Peak load overview
Energy Cost calculation
MVP
Sketching ideas
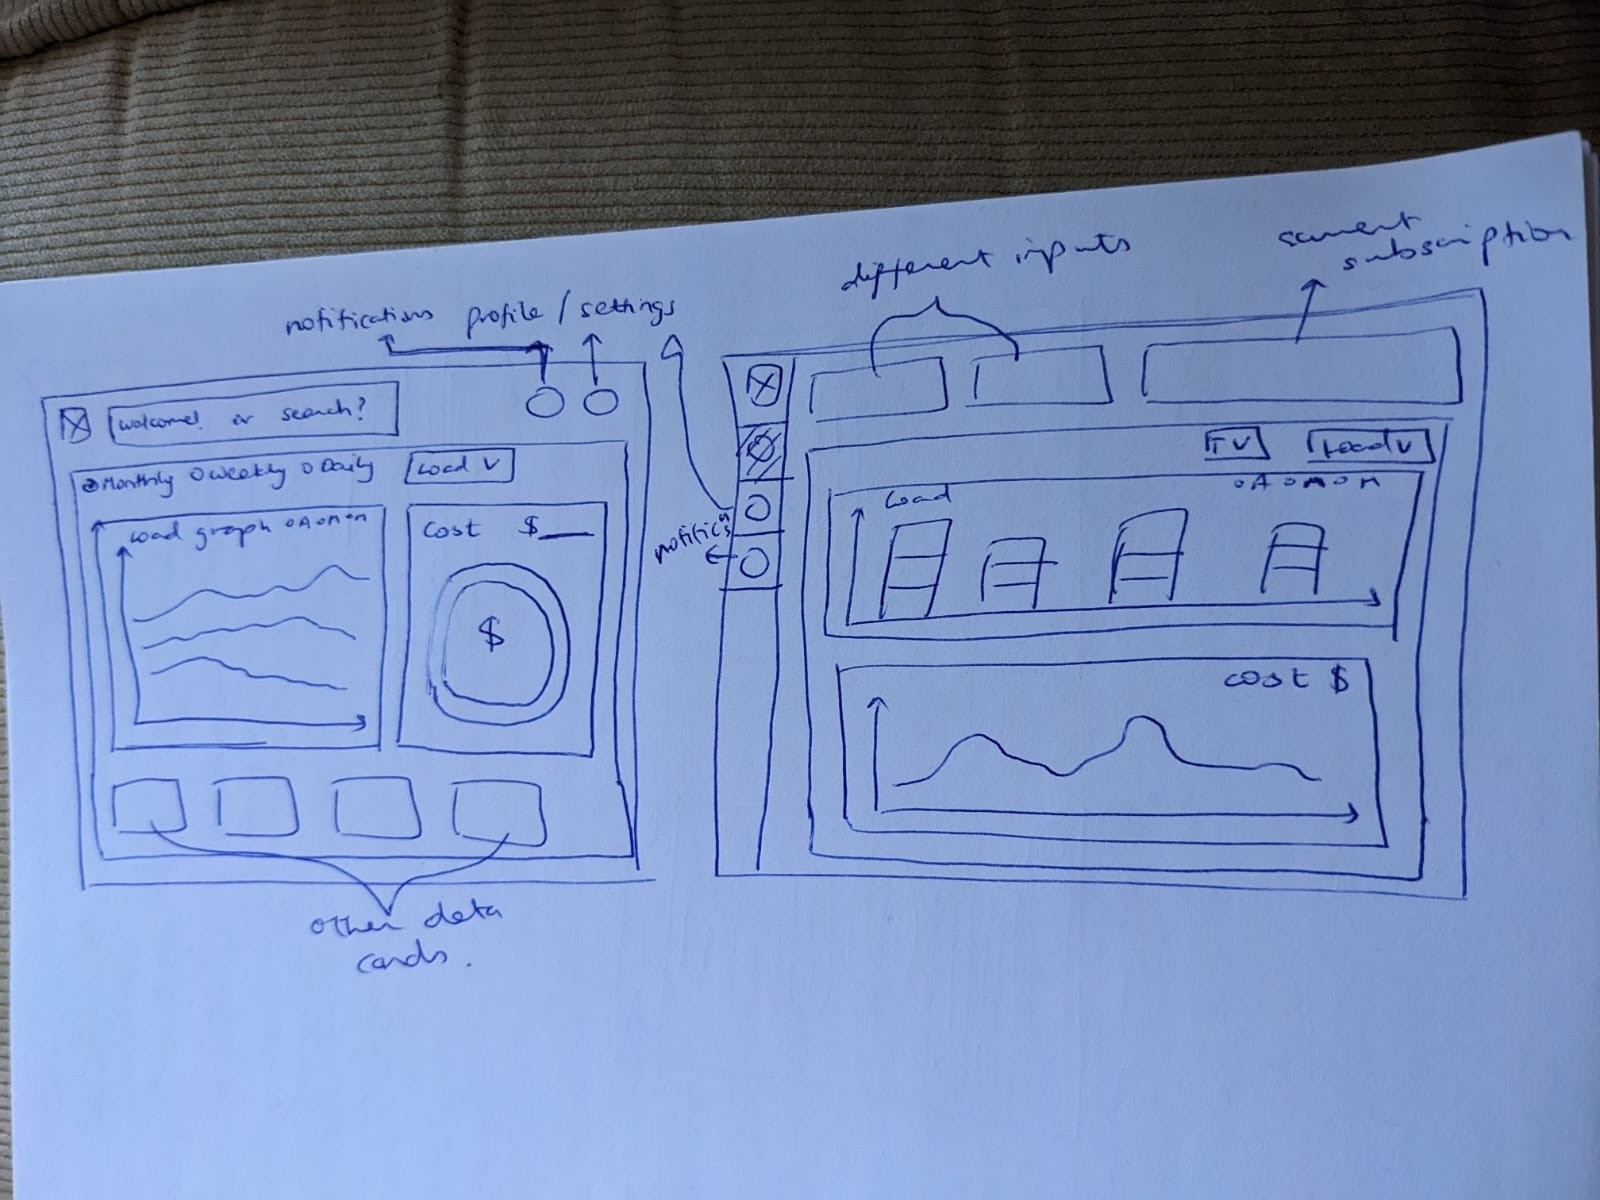
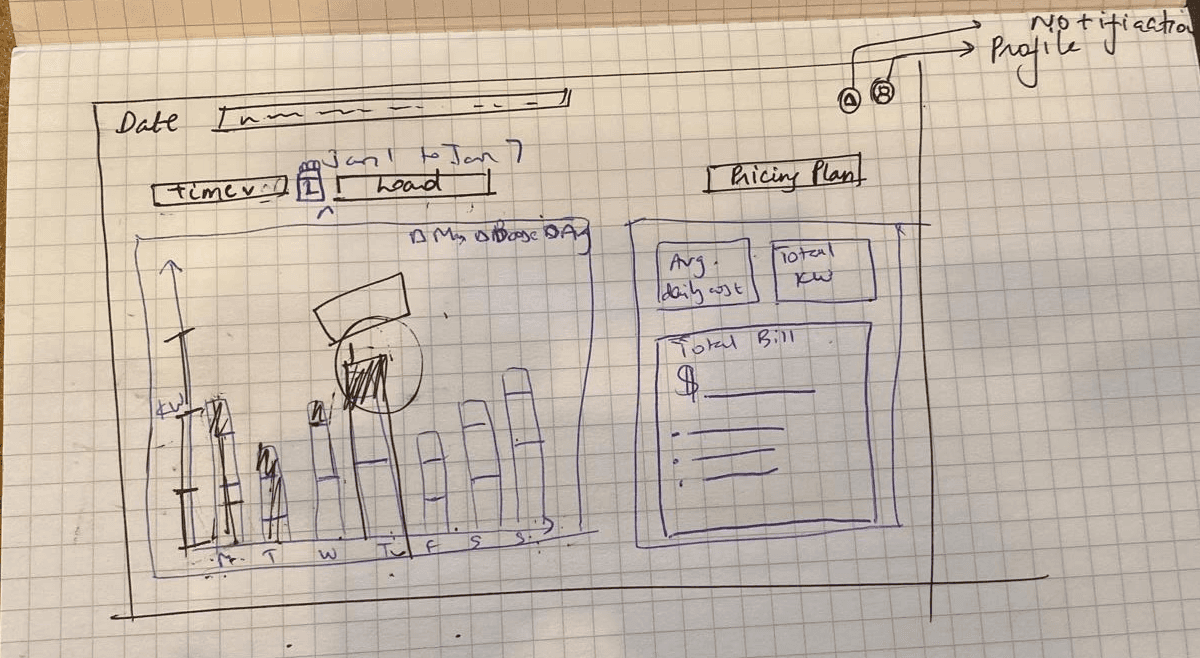
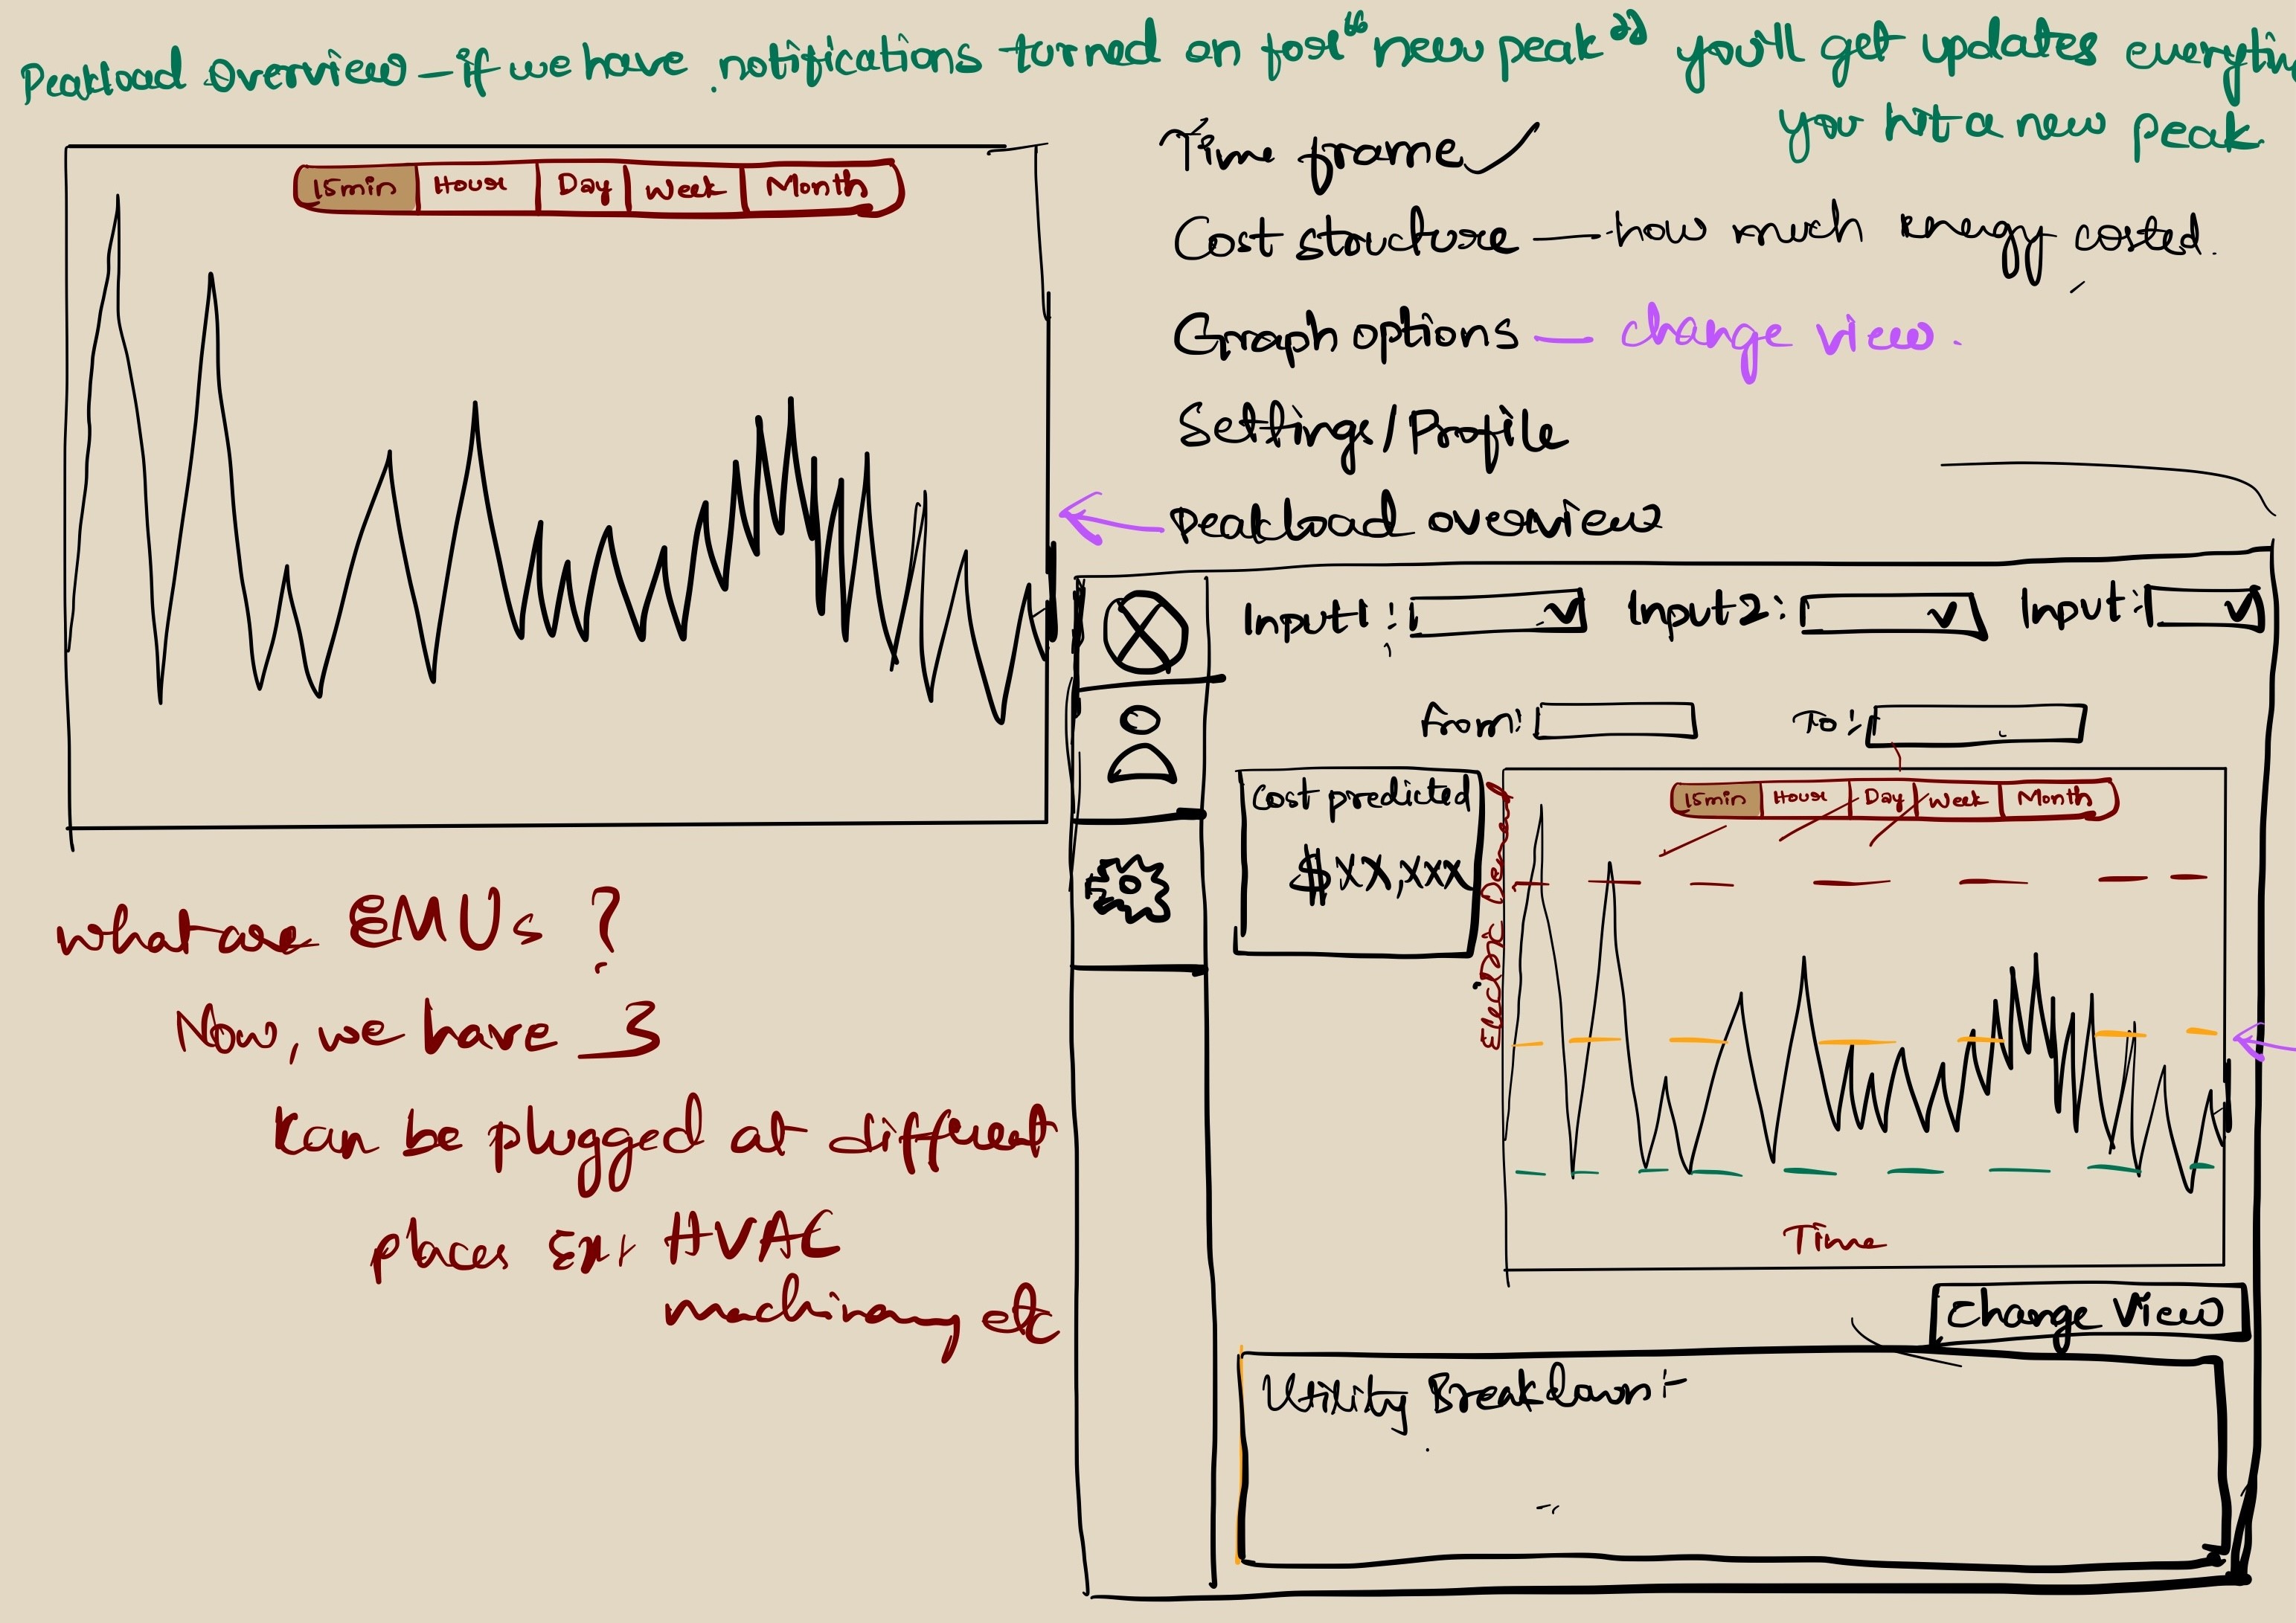
We started sketching for Tablet view dashboard considering the environment and accessibility needs of a plant manager working in a manufacturing unit. This helps with enhanced visibility and comparison of data, and on-the-go monitoring for the plant managers.
From Sketches to Prototype
After sketching and finalizing the flow chart, we proceeded to the prototyping stage. Our goal was to transform the visual flow into an interactive experience that would give us a look at how users might navigate and interact with the design.
Key Takeaways
Activities like Environmental analysis, Business Model Canvas, and Value Proposition Canvas helped me gain a holistic understanding of the business quickly.
The agile nature of the project helped us to be quicker and leaner with the product, which helped us prioritize our MVP based on both business and user needs.
We may not always have user research resources as designers, so we must make decisions based on available information. Regular feedback from stakeholders and fellow designers helped us to be on the right path.
Throughout the project, we had a "user first" mentality, including our presentations. Delivering the presentations with heavy user-centered storytelling, helped us bring stakeholders on board quickly as they empathized with users easily.
Coffee gives me jitters, how 'bout a cuppa tea?
From identifying problems to creating beautiful solutions, I got you covered :)
© 2024 Kavya Maragoni